A Case Study in Social Media Demographics [Infographic]
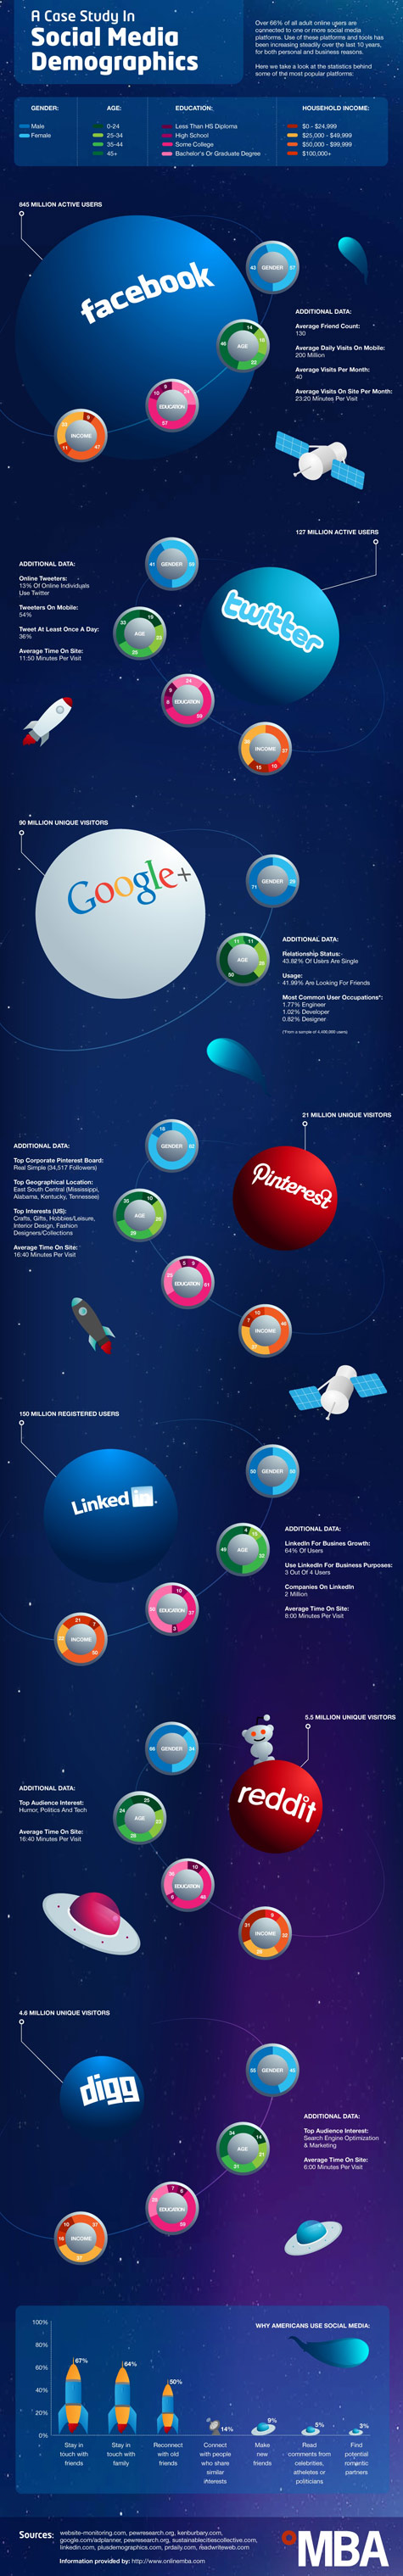
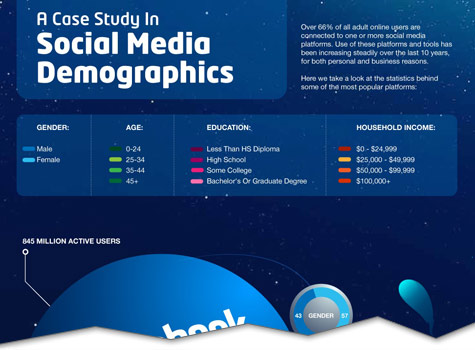 More than two-thirds of all adult online users are involved with social media sites and each social platform appeals to a slightly different demographic. This leads marketers to wonder about the average face on Facebook, the typical group on Google+ and the population using Pinterest. For a picture of the social media statistics defining the average audience on each network, Mashable.com posted an enlightening infographic created by Online MBA. It first reveals each site’s dominant social media demographics in terms of gender, age, income, and education. It also shows site-specific statistics, such as that 54 percent of Twitter users tweet on mobile, 64 percent of LinkedIn members use the site for business growth, and Facebook users average 40 visits per month. Finally, it illustrates why so many Americans are clicking and sticking with social media.
Infographic – Online MBA
Learn more about the Value of Infographics.
Check out some of MDG’s social media infographics:
Social vs. Search
The ROI of Social Media
A Marketer’s Guide to Pinterest
How Social Media Changed the Ad Game
The Social Campaign: The Growing Reach of Social Media’s Election Impact
Politcal Fundraising in the Social Media Era
To discover the most innovative ways to leverage the power of social media and infographics, contact MDG today at 561-338-7797, or visit www.mdgsolutions.com.
Source: Mashable.com.